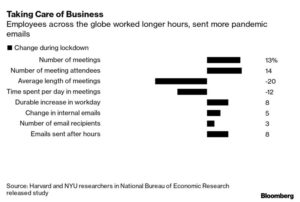
 Feeling overworked? You’re not alone. A study of 3.1 million workers around the world found that the pandemic workday is longer and has more meetings. You can read more about the study in Bloomberg here, the research background summary here, and the full research paper here.
As meeting science nerds, we’d love to know more about the study methodology, such as whether they included or excluded the number of ‘self-meetings‘ (where attendee = 1) in their analysis? This was unclear from the meeting variables table in the study.
- meeting volatility by company size. For example, we’ve seen comparative decreases in meeting load for smaller companies during COVID-19, while there are comparative increases in meeting load for larger companies.
- the number of meetings appearing on calendars that are not work-related. With the impact of COVID-19 and stay-at-home orders, with more people scheduling time blocks for ‘meetings at home,’ this could muddy the analysis. It would be helpful to separate work meetings from non-work meetings-on-the-calendar-
during-the-work-day. - presence of agenda in meetings with 2 or more people. We see very, very low (single-digit) percentages of meetings with agendas. People might be meeting more frequently and in greater sizes (per your research), but if they are not meeting with a defined purpose, goal or agenda, those are more meetings twisting in the wind.
- the happy-hour effect. With regard to their analysis that shows the lengthening of the workday, we’re curious if they were/are able to do any text-based processing for subject lines that include ‘happy hour’ or related ‘team coffee’ etc. While we’ve definitely seen the workday lengthen (in some instances, almost 20% of meetings take place outside of 9am – 6pm in the local time zone of the meeting organizer), the happy hour effect might introduce some noise in the workday boundaries.
- workday span as a function of the meeting organizer’s local time zone. Is the organizer of a meeting more impacted by his or her attendees, or is it the other way around?
- the % of meeting invitees that ‘needs action.’ For example, here’s an aggregate sample data set of meeting accepted/tentative/needs action/declined; we have not specifically examined increases or decreases in the rates of each pre / mid COVID-19:
64%
3%
27%
5%
87,069
3,744
37,108
7,395
Accepted
Tentative
Needs Action
Declined
All this is to say that the meetings the research team analyzed might actually be under-represented by virtue of the tentative/needs action counts.


